
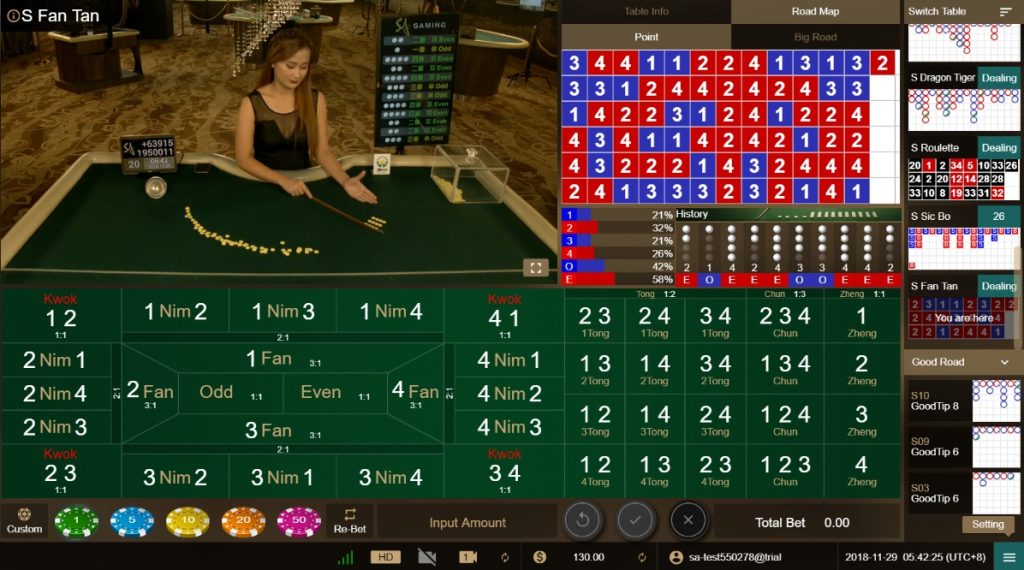
Fan Tan is one of the oldest and most straightforward casino games, relying on a pile of white beads or buttons divided into groups of four to determine a final remainder between 1 and 4. Despite its simplicity, both land-based and online Fan Tan tables display detailed digital scoreboards filled with colored dots, numbers, and grids.
These visual displays—known as Fan Tan history charts or scorecards—can look overwhelming at first glance. This guide breaks down what history charts are, how they work, how to read their various formats, and how to use them effectively without falling into common psychological traps.
What Is a Fan Tan History Chart?
A Fan Tan history chart is a real-time visual record of previous game outcomes at a specific table. After each round, once the dealer counts down the beads and reveals the final remaining count (1, 2, 3, or 4), the result is logged automatically onto a digital display screen adjacent to the table.
How History Charts Work
History charts record each round sequentially from left to right or top to bottom, depending on the grid layout. Each cell in the grid represents a single completed round and typically displays:
- The final remainder number (1, 2, 3, or 4).
- Color-coded indicators assigned to specific numbers or side bets (such as Big/Small or Odd/Even).
Why Players Use History Charts
Players reference history charts primarily to:
- Track table flow: Rapidly review recent outcomes without memory strain.
- Identify short-term trends: Observe if certain numbers or secondary categories (like Odd vs. Even) are appearing frequently.
- Formulate betting strategies: Align wagers with perceived table momentum, such as following a hot number or betting against a long run.
Types of Fan Tan History Charts
Online live dealer suites (such as Evolution or Pragmatic Play) and modern land-based electronic scoreboards typically display three main views to represent game data.
+-----------------------------------------------------------------------+
|                       FAN TAN SCOREBOARD TYPES                        |
+-------------------+---------------------------------------------------+
| Chart Type        | Primary Function                                  |
+-------------------+---------------------------------------------------+
| Bead Road         | Direct chronological log of raw outcomes (1–4)   |
| Trend Chart       | Visualizes side-bet categories (Odd/Even, Big/Sm) |
| Result History    | Numerical summary percentages & statistical totals|
+-------------------+---------------------------------------------------+
1. Bead Road (Main Grid)
The Bead Road is the primary display layout. It shows exact results in the precise order they occurred.
- Grid Layout: Usually 6 rows deep, filling column by column from left to right.
- Symbols: Colored circles (beads) containing numbers 1, 2, 3, or 4.
- Color Schemes: Each number is assigned a distinct color (e.g., 1 = Red, 2 = Green, 3 = Blue, 4 = Yellow).
2. Trend Chart (Roadmaps)
Trend charts adapt the raw results into specific side-bet pairings, similar to baccarat roadmaps:
- Big / Small Road: Classifies 1 & 2 as Small, and 3 & 4 as Big.
- Odd / Even Road: Classifies 1 & 3 as Odd, and 2 & 4 as Even.
When a result repeats the same category (e.g., three consecutive “Big” outcomes), the symbols stack vertically in the same column. When the category switches (e.g., from “Big” to “Small”), the chart moves to start a new column.
3. Result History (Summary Bar)
The Result History section compresses recent rounds (typically the last 50 to 100 hands) into raw statistics and percentages:
- Total distribution percentages for each number ().
- Percentage splits for Odd vs. Even and Big vs. Small.
How to Read a Fan Tan History Chart
Reading a scorecard effectively requires converting raw symbols into meaningful game context.
1. Understanding Winning Results
Each entry on a Bead Road grid gives you immediate information about that specific round:
- Primary Number: The central number () dictates standard single-number bets (Fan), double-number bets (Nim/Kwok), and three-number bets (Nga/Ssh).
- Side-Bet Badges: Small secondary dots or background highlights may indicate whether the result was Odd/Even or Big/Small.
2. Identifying Streaks
A streak occurs when the same outcome or category lands multiple times in succession.
- Single-Number Streaks: Consecutive appearances of the same exact remainder (e.g., three s in a row).
- Category Streaks: Consecutive outcomes belonging to the same side category (e.g., five “Even” results in a row). On Trend Charts, streaks appear as long vertical lines of matching colored symbols.
3. Spotting Repeating Patterns
Players often look for structured alternating patterns on the board:
- Single Alternation (Ping-Pong): Alternating outcomes round after round (e.g., or ).
- Double Alternation: Pairs of outcomes alternating consistently (e.g., ).
What Fan Tan History Charts Can and Can’t Tell You
Understanding the statistical limitations of history charts is essential for maintaining a clear perspective while playing.
What They CAN Tell You
- Past Events: An accurate, verifiable history of previous bead counts at that table.
- Statistical Distribution: How evenly or unevenly numbers have appeared over a specific sample size.
What They CAN’T Tell You
- Future Outcomes: Past rounds have zero mechanical influence on future rounds.
- Due Numbers: A number that hasn’t appeared in 20 rounds is no more likely to appear on the next round than any other number.
Key Rule of Probability: Fan Tan uses independent events. Because beads are reshuffled and randomly grouped every round, the probability of any remaining count () remains exactly 25% on every single hand, regardless of past results.
Common Misconceptions About Predicting Outcomes
The most frequent trap for players reading history charts is the Gambler’s Fallacy—the belief that random outcomes self-correct in the short term. For example, assuming “Big” must land next because “Small” has landed five times in a row is mathematically incorrect.
Tips for Using Fan Tan History Charts
1. Focus on Trends, Not Predictions
Use history charts as an organizational tool rather than a predictive device. If you prefer betting with table momentum, trend charts help you follow current table flow cleanly without relying on memory.
2. Combine History Charts with Bankroll Management
No pattern or chart reading technique alters the built-in house advantage. Always pair chart tracking with disciplined betting parameters:
- Set clear win/loss limits per session.
- Size your base bet at 1–2% of your total session bankroll.
- Avoid increasing bet sizes solely to reclaim losses after a trend breaks.
Common Mistakes When Reading History Charts
- Chasing Streaks: Entering a streak late after it has already run for many rounds, assuming it will continue indefinitely.
- Assuming Patterns Will Continue: Overcommitting capital because a pattern looks symmetrical on the grid.
- Ignoring Bet Coverage: Forgetting that Fan Tan offers multi-number bets (like Kwok covering two numbers, or Nga covering three). Relying solely on single-number charts while ignoring coverage options increases volatility unnecessarily.
Fan Tan history charts are valuable interface tools that keep game data clear, organized, and accessible. While Bead Roads and Trend Charts highlight fascinating short-term patterns, remember that every round remains an independent event with equal probabilities. Enjoy tracking trends as part of the game’s rich presentation, but keep your primary strategy focused on smart bet selection and strict bankroll discipline.